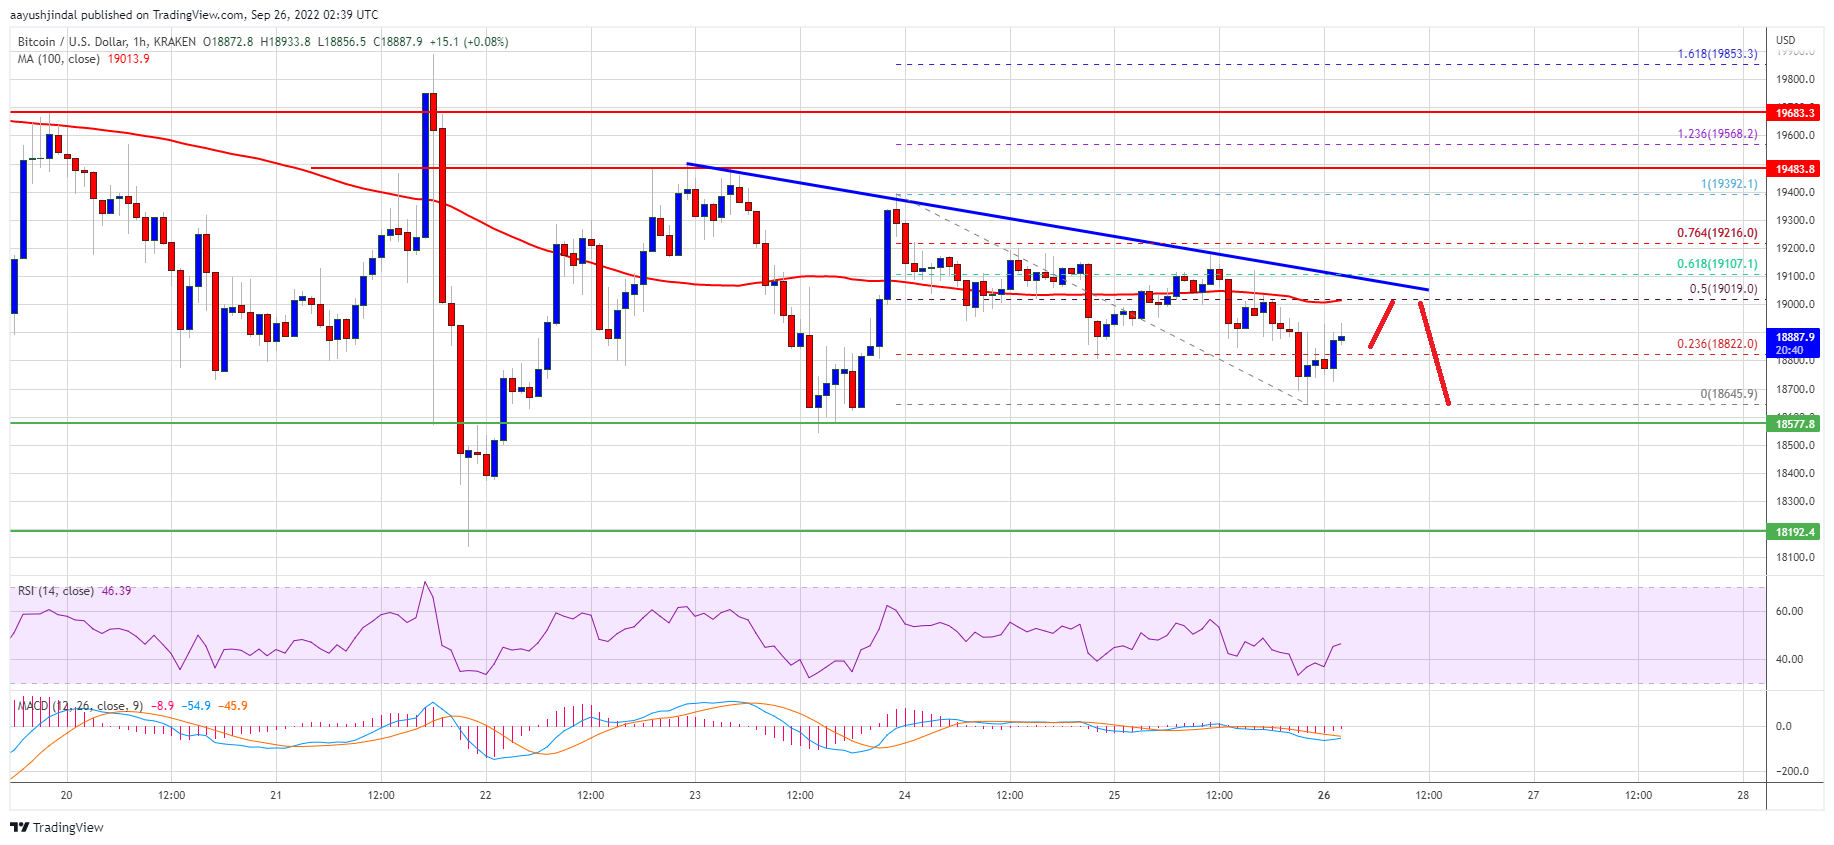
Bitcoin is holding the key $18,500 support zone against the US Dollar. BTC must settle above the $20,000 resistance zone to move into a positive zone.
- Bitcoin is struggling to gain momentum above the $19,500 resistance zone.
- The price is trading below $19,000 and the 100 hourly simple moving average.
- There is a key bearish trend line forming with resistance near $19,020 on the hourly chart of the BTC/USD pair (data feed from Kraken).
- The pair could stage a fresh rally if there is a clear move above the $19,500 resistance zone.
Bitcoin Price Consolidates
Bitcoin price made another attempt to clear the $19,500 resistance zone. However, BTC struggled and formed a short-term top near the $19,400 level.
A high was formed near $19,392 and the price declined. There was a move below the $19,000 level and the 100 hourly simple moving average. The pair traded as low as $18,645 and is currently consolidating losses. There was a minor increase above the $18,800 level.
Bitcoin price climbed above the 23.6% Fib retracement level of the recent decline from the $19,392 swing high to $18,645 low. On the upside, an immediate resistance is near the $19,000 level and the 100 hourly simple moving average.
There is also a key bearish trend line forming with resistance near $19,020 on the hourly chart of the BTC/USD pair. The trend line is near the 50% Fib retracement level of the recent decline from the $19,392 swing high to $18,645 low.
The next major resistance sits near the $19,500 zone. A close above the $19,500 level might start a fresh surge to $20,000. Any more gains might start a steady increase and the price might rise towards the $21,500 resistance zone.
Fresh Decline in BTC?
If bitcoin fails to recover above the $19,500 zone, it could start a fresh decline. An immediate support on the downside is near the $18,650 zone.
The next major support is near the $18,500 level. A clear move below the $18,500 zone could set the pace for a fresh decline. In the stated case, the price may even test the $17,500 level.
Technical indicators:
Hourly MACD – The MACD is now losing pace in the bullish zone.
Hourly RSI (Relative Strength Index) – The RSI for BTC/USD is now just below the 50 level.
Major Support Levels – $18,650, followed by $18,500.
Major Resistance Levels – $19,000, $19,350 and $19,500.
Check other news for today and Please stand by..
*********************************
If one of the paying programs on our Monitor appeals to you, please support EmilyNews by registering for it on our website. Thanks very very much!
EN web Support Chat | Hyips and Crypto questions – HyipChatEN
Telegram Chat for Crypto and Hyip reports: @HyipChatEN
*********************************
Be the first to get most important HYIP news everyday!
Simply Follow EN Facebook, EN Telegram, EN Twitter
or Subscribe to EN Feedburner and submit your email address!
If you like this article and want to support EN – please share it by using at least few of social media buttons below. Thanks and See you tomorrow!


