
Bitcoin fell to its lowest levels since mid-April on high US inflation data and continued military action in Iran despite a 60-day ceasefire being reportedly near to completion.
Bitcoin (BTC) hit six-week lows on Thursday as geopolitical and macroeconomic volatility took its toll on an already weak market.
Key points:
- Bitcoin price downside accelerates on Iran strikes and the highest US PCE inflation data since 2023.
- News of an Iran ceasefire awaiting a sign-off by US President Donald Trump struggled to lift the market.
- Traders mark key support and resistance lines in the sand going forward.
Bitcoin drops below $72,000 with US inflation “in full swing”
Data from TradingView showed new local lows of $72,462 for BTC/USD — a level not seen since April 13.
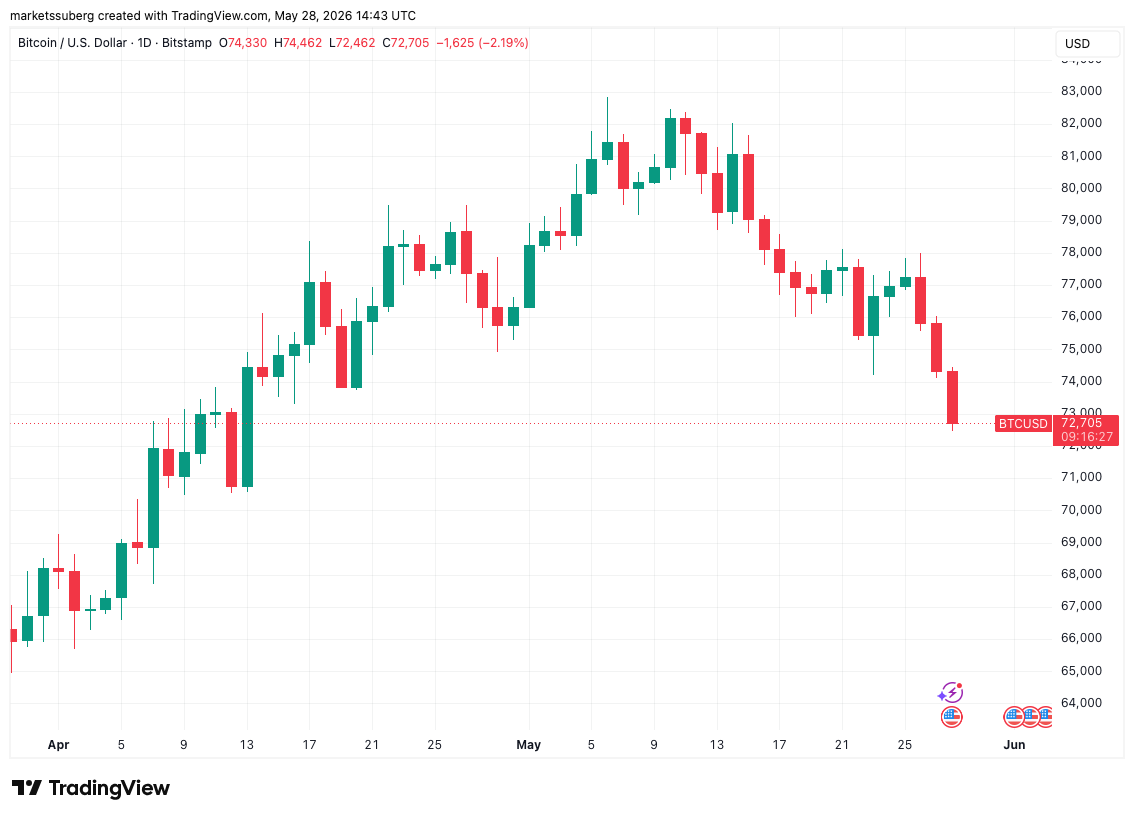
BTC/USD one-day chart. Source: Cointelegraph/TradingView
Downside accelerated amid new US strikes on Iran, while the April print of the Personal Consumption Expenditures (PCE) Index showed inflation at its highest since 2023.
PCE, known as the Federal Reserve’s “preferred” inflation gauge, came in at 0.4% month-on-month and 3.8% year-on-year, respectively, per data from the Bureau of Economic Analysis (BEA).
Reacting, trading resource The Kobeissi Letter noted that annual PCE was running at nearly twice the intended level of 2%.
“The Fed’s top inflation metric is nearly double their target,” it wrote in a post on X.
“Inflation is back in full-swing.”
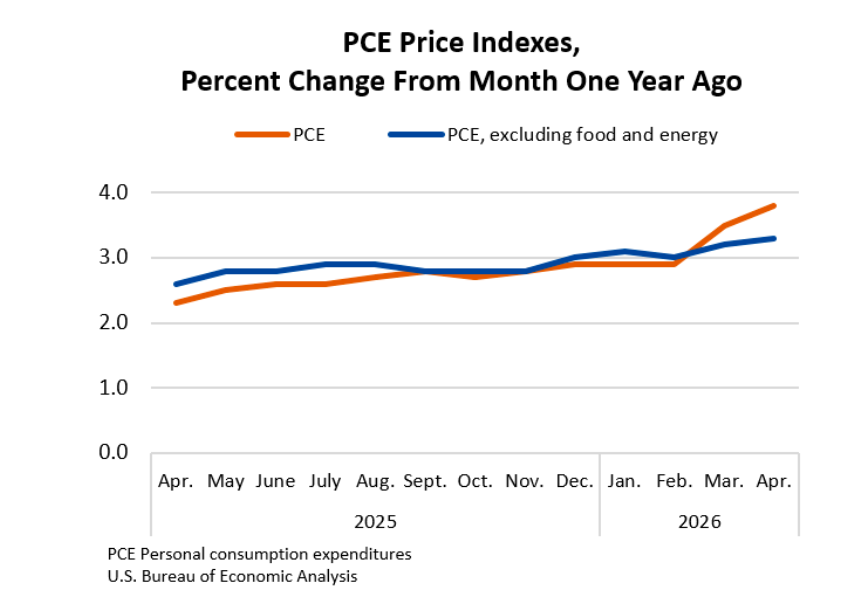
US PCE index % change (screenshot). Source: BEA
Downside pressure on risk assets was tapered thanks to reports of a 60-day US-Iran ceasefire now awaiting approval from President Donald Trump.
“US markets hit fresh record highs on the news,” Kobeissi reported, quoting details of the plan from Axios.
BTC price can still protect higher lows
Among Bitcoin traders, attention in the current range focused on the April 2025 yearly lows for BTC/USD just below $75,000.
Related: Bitcoin bids farewell to CME futures gaps with $67K still on the radar
“Would also say by the weekly close we need to be back above the 2025 Yearly Lows for bulls. A lot of work needs to happen,” Castillo Trading wrote in their latest X update.
Castillo noted that the price could drop to as low as $70,800 and still confirm a higher low, which would preserve a multi-month uptrend.
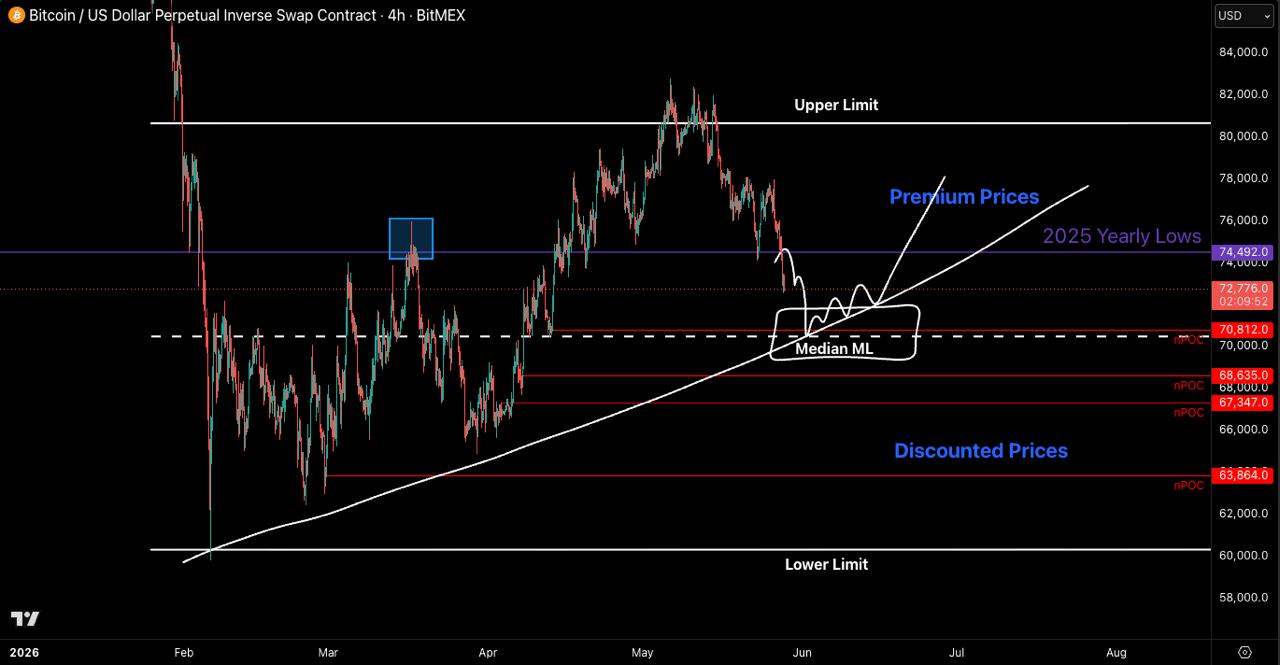
BTC/USDT perpetual inverse swap four-hour chart. Source: Castillo Trading/X
Above, the 200-day simple (SMA) and exponential (EMA) moving averages featured as renewed resistance.
“Putting in a similar reaction after that horizontal level and Daily 200MA/EMA retest compared to January this year,” trader Daan Crypto Trades commented.
“Another lower high in the bigger down trend until proven otherwise.”
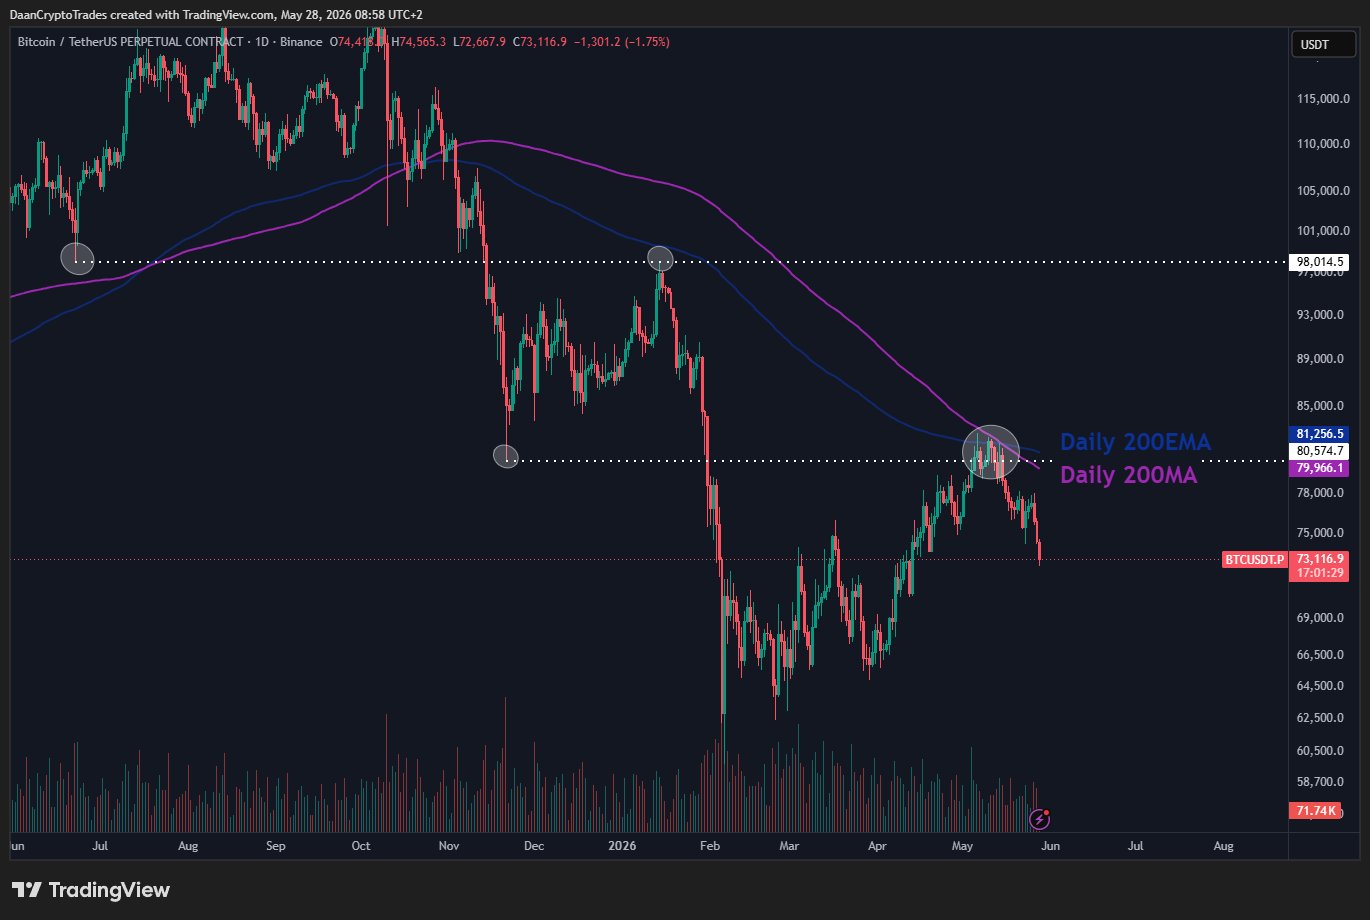
BTC/USDT perpetual contract one-day chart. Source: Daan Crypto Trades/X
*********************************
If one of the paying programs on our Monitor appeals to you, please support EmilyNews by registering for it on our website. Thanks very very much!
EN web Support Chat | Hyips and Crypto questions – HyipChatEN
Telegram Chat for Crypto and Hyip reports: @HyipChatEN
*********************************
Be the first to get most important HYIP news everyday!
Simply Follow EN Facebook, EN Telegram, EN Twitter
or Subscribe to EN Feedburner and submit your email address!
If you like this article and want to support EN – please share it by using at least few of social media buttons below. Thanks and See you tomorrow!