Bitcoin fell for a fourth consecutive day on Friday. Another spike in US inflation fueled fears of more aggressive Fed rate hikes to curb inflation.
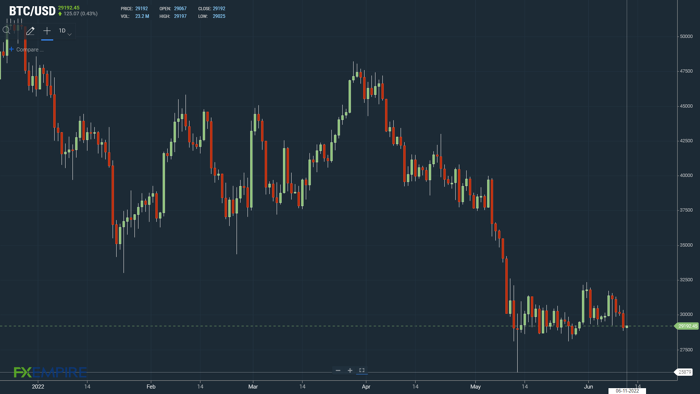
- On Friday, bitcoin (BTC) slid by 3.4% to end the day at $29,067. The bearish session saw bitcoin fall to sub-$29,000 before finding support.
- Market jitters over inflation were justified, with US inflation accelerating to a new 40-year high.
- The Bitcoin Fear & Greed Index saw a modest rise this morning, despite Friday’s sell-off.
On Friday, bitcoin (BTC) slid by 3.4%. Following a 0.35% loss on Thursday, bitcoin ended the day at $29,067.
A mixed start to the day saw bitcoin strike an early morning high of $30,337 before hitting reverse.
Falling short of the First Major Resistance Level at $30,533, bitcoin slid to a day low of $28,840.
Bitcoin fell through the First Major Support Level at $29,779 and the Second Major Support Level at $29,474. Steering clear of the Third Major Support Level at $28,720, bitcoin partially recovered to end the day at $29,067.
The Bitcoin Fear & Greed Index Provides Little Market Comfort
Today, the Fear & Greed Index rose from 11/100 to 12/100. While the Index increased, despite Friday’s sell-off, the Index remains deep within the “Extreme Fear” zone, reflecting investor fear of further downside.

In May, the US annual rate of inflation accelerated from 8.3% to a new 40-year high of 8.6%. The spike supports a more aggressive Fed interest rate path trajectory to curb inflation.
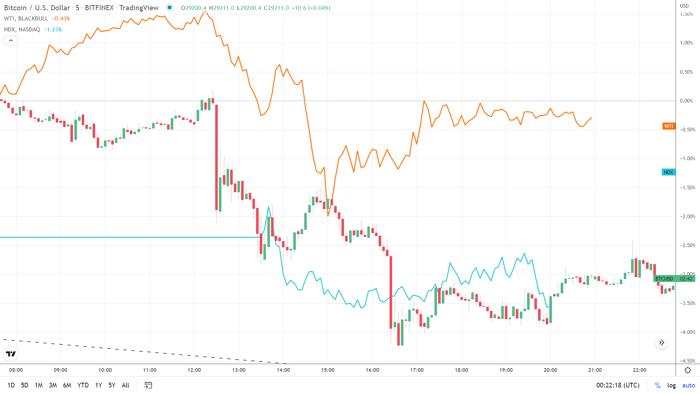
Bitcoin tracked the NASDAQ 100 through the US session, while the inverse correlation with WTI crude oil prices softened.
With the Fed delivering its June monetary policy decision next week, it could be a testy weekend ahead.

Bitcoin (BTC) Price Action
At the time of writing, BTC was up 0.43% to $29,192.
A range-bound start to the day saw BTC fall to an early morning low of $29,025 before striking a high of $29,197.

Technical Indicators
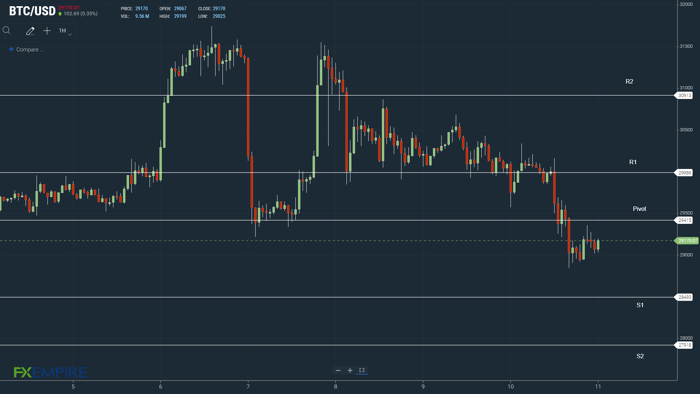
BTC will need to move through the $29,415 pivot to target the First Major Resistance Level at $29,986.
BTC would need the broader crypto market to support a breakout from $29,500.
An extended rally would test the Second Major Resistance Level at $30,913 and resistance at $31,500.
Failure to move through the pivot would test the First Major Support Level at $28,493. Barring another extended sell-off, BTC should steer clear of sub-$28,000 levels. The Second Major Support Level sits at $27,918.

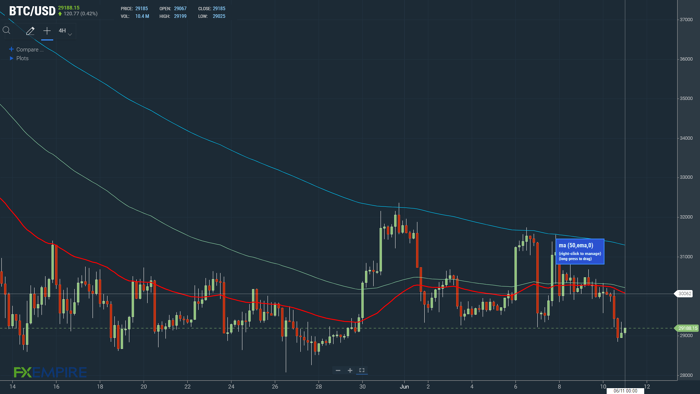
Looking at the EMAs and the 4-hourly candlestick chart (below), it is a bearish signal. Bitcoin sits below the 50-day EMA, currently at $30,062. The 50-day EMA fell back from the 100-day EMA. The 100-day EMA eased back from the 100-day EMA, bitcoin price negative.
A move through the 50-day EMA and through the 100-day EMA, currently at $30,225 would support a run at the 200-day EMA, currently at $31,300.

Check other news for today and Please stand by..
*********************************
If one of the paying programs on our Monitor appeals to you, please support EmilyNews by registering for it on our website. Thanks very very much!
EN web Support Chat | Hyips and Crypto questions – HyipChatEN
Telegram Chat for Crypto and Hyip reports: @HyipChatEN
*********************************
Be the first to get most important HYIP news everyday!
Simply Follow EN Facebook, EN Telegram, EN Twitter
or Subscribe to EN Feedburner and submit your email address!
If you like this article and want to support EN – please share it by using at least few of social media buttons below. Thanks and See you tomorrow!

