This is the right time for a brief statistical information and preditions of further Bitcoin price movements.
As it usually happens in most critical moments, there are two camps of analysts. Those who still believe in another pomp and extreme rise up of price and those who already said that the bull market is officially over.. Well, some positive (even at a local timeframe) points will be appreciated, i think..
*I strongly advice you to have your own strategy of holdings, investments and exchanging into your local currencies anytime, no matter what bears or bulls are talking…

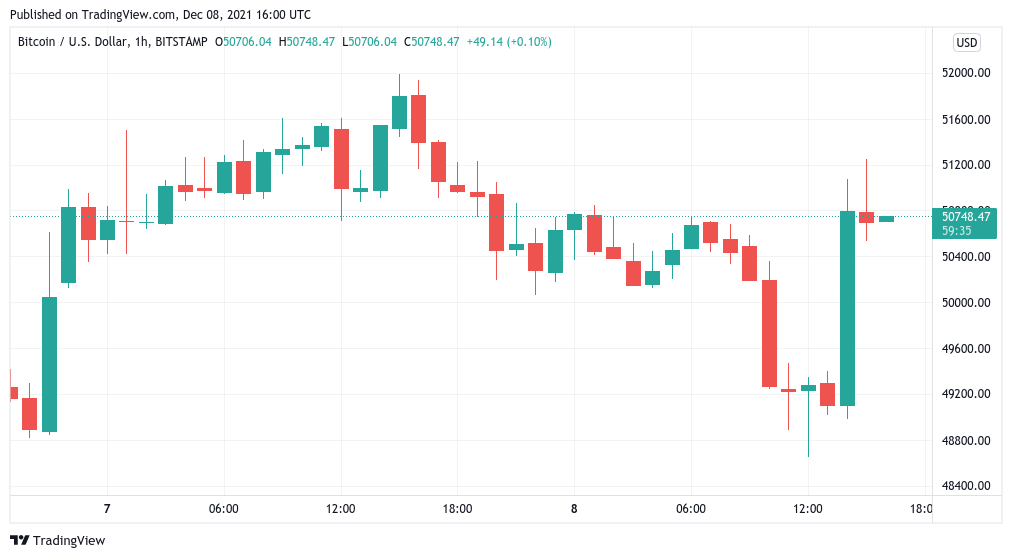
Bitcoin (BTC) recovered from a dip below $50,000 on Dec. 8 as Wall St. trading opened on a fresh bullish note.

Bitcoin market ditches “extreme fear”
Data from Cointelegraph Markets Pro and TradingView captured a classic rally for BTC/USD on hourly timeframes, gaining $2,000 in a single one-hour candle.
The pair had hit daily lows of $48,656 on Bitstamp before a dramatic trend change brought back the psychologically significant $50,000 level.
Buckle up
— Zhu Su (@zhusu) December 8, 2021
#Bitcoin held crucial level and continues probably to a new test at $51.6K and $53.6K.
Nice!
— Michaël van de Poppe (@CryptoMichNL) December 8, 2021
As positive signals began to emerge from well-known names on social media, sentiment likewise felt the benefit, exiting “extreme fear” for the first time since Friday’s crash below $42,000.
Popular trader Rekt Capital, who earlier eyed healthy behavior on the weekly chart, meanwhile added that BTC price action could be mimicking its recovery seen during September’s major dip. This involved acting between two exponential moving average (EMA) lines.
“Bitcoin may be repeating a consolidation period it also experienced following its May 2021 crash,” he tweeted.
“This consolidation takes place between the blue 50-week EMA support and green 21-week EMA resistance.”

Exchange Bitcoin holdings drain faster since sell-off
On-chain metrics continued to please on Wednesday, against a backdrop of network fundamentals shaking off spot price action by nearing new record highs.
Almost 80% of the BTC supply was still in profit at lower levels, according to data from on-chain analytics firm Glassnode, this nonetheless constituting a one-month low.

A look at the BTC balance on exchanges added to the positivity, reserves at their lowest in multiple years and far below when Bitcoin traded at four figures.
Last week’s dip failed to upend the trend, which in fact accelerated over the weekend, data from on-chain analytics platform CryptoQuant confirms.

Check other news for today and Please stand by..
*********************************
If one of the paying programs on our Monitor appeals to you, please support EmilyNews by registering for it on our website. Thanks very very much!
EN web Support Chat | Hyips and Crypto questions – HyipChatEN
Telegram Chat for Crypto and Hyip reports: @HyipChatEN
*********************************
Be the first to get most important HYIP news everyday!
Simply Follow EN Facebook, EN Telegram, EN Twitter
or Subscribe to EN Feedburner and submit your email address!
If you like this article and want to support EN – please share it by using at least few of social media buttons below. Thanks and See you tomorrow!

